

.avif)
A growth chart for boys converts height-and-weight measurements into percentiles, and that number can worry parents more than it should. Reading it well comes down to knowing which chart applies at each age, how to find the percentile, and what signals a problem.
How a Growth Chart for Boys Works
A growth chart shows how a boy’s height and weight compare with other boys of his age, and turns that comparison into a percentile. A boy is always plotted on a boys-only chart because boys and girls grow at different paces, and that keeps the percentile a fair reflection of where he stands.
What doctors track also changes as a child grows. For babies, they measure length, weight, and head size. From age 2 onward, they look at height, weight, and BMI (body mass index).
The Two Charts Boys Are Measured On
Childhood splits into two charting periods at age 2.
- Birth to 2 years: The CDC recommends the WHO growth standards for boys this young. One detail that surprises parents is that these standards are based on breastfed infants. The weight curves show growth slowing a little after about three months, which is normal.
- 2 to 20 years: Boys move to the CDC growth charts, which add BMI-for-age and use standing height.
Two things change when a boy moves from the first chart to the second. The WHO charts are a growth standard — a picture of how children grow in ideal conditions — while the CDC charts are a growth reference, a record of how American children actually grew. The measurement changes too: a boy measured lying down reads about 0.8 cm longer than the same boy standing. Both shifts live in the chart, not in the child, so a percentile that moves at the 2-year visit is usually telling you nothing about his growth.
Finding the Percentile
Reading one point on the chart takes about three moves. Take a 4-year-old boy who is 40 inches tall:
- Find his age along the bottom of the chart and trace straight up.
- Find his height on the side and trace straight across.
- The point where the two lines meet sits near the 50th percentile curve, meaning he is taller than about half of boys his age and shorter than the other half.
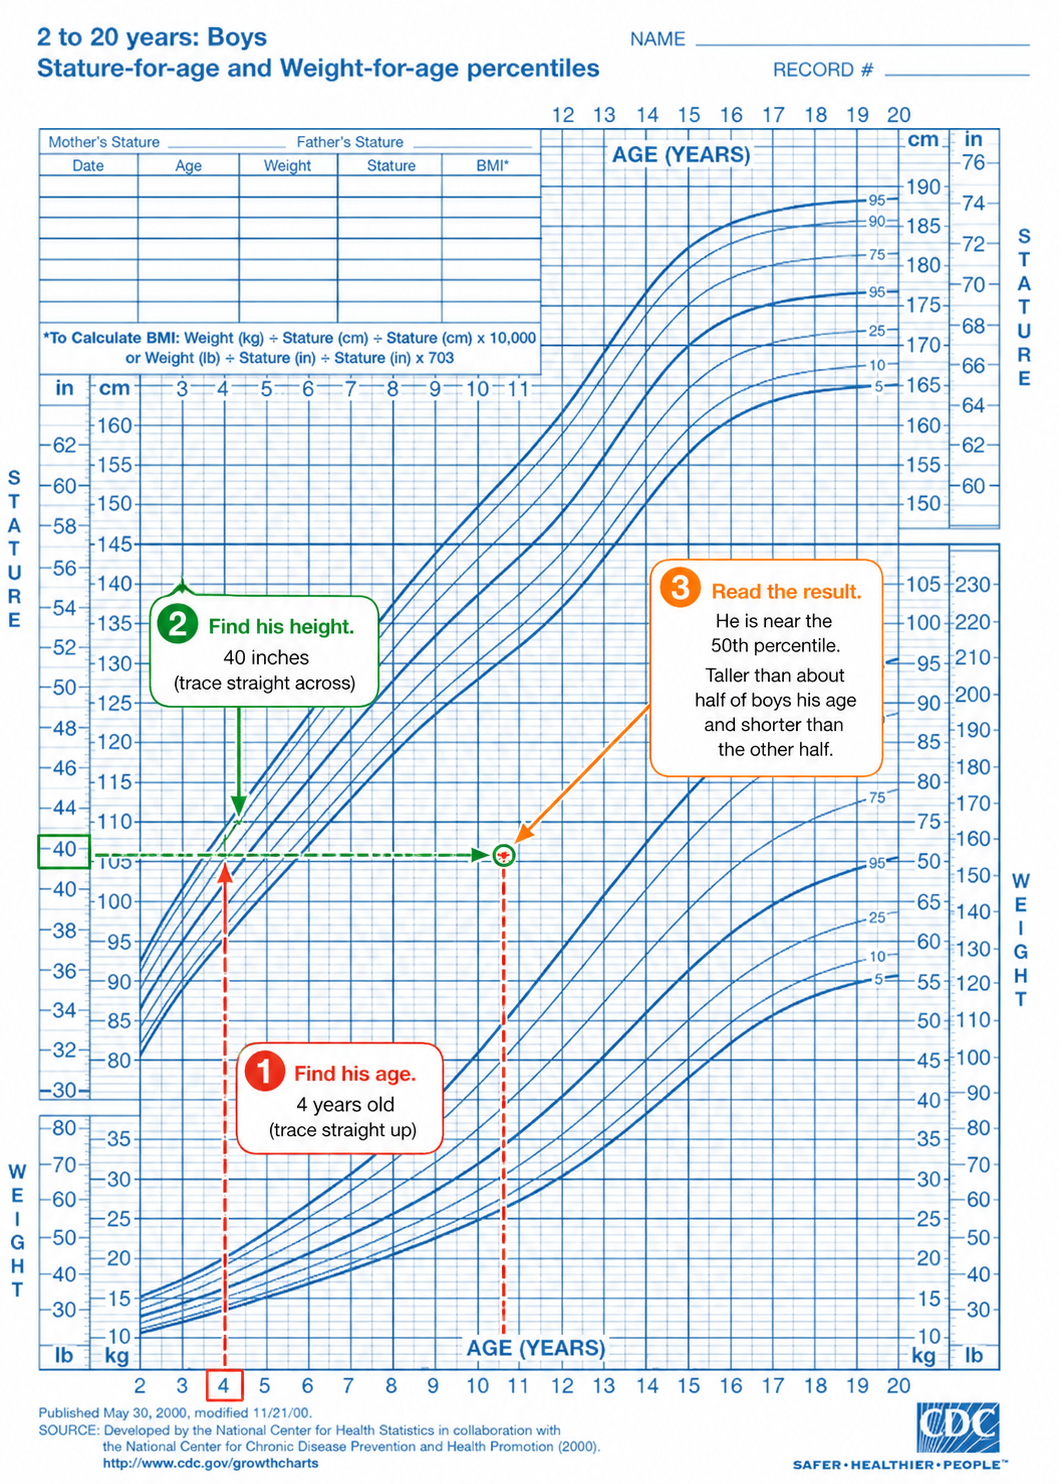
CDC growth chart for boys, ages 2 to 20 (stature and weight by age). Source: CDC.
The same method works for weight and BMI. Each curved line on the chart represents a labeled percentile — usually the 5th, 10th, 25th, 50th, 75th, 90th, and 95th, though some versions print the 3rd and 97th as the outer curves — and the one closest to the point is the boy's approximate ranking.
Why the Trend Tells You More Than the Number
A single percentile shows where a boy stands today, but the trend across visits tells you far more. Most boys settle onto a curve early and stay close to it for years, so a boy holding near the 75th percentile from toddlerhood into grade school is simply taller than average, and that's healthy.
What gets a provider's attention is a change in direction. If a boy crosses two or more of the major percentile curves between visits, up or down, or his curve flattens when it should still be climbing, that's worth checking.
Usually, there's an ordinary reason behind it, like a growth spurt, a recent illness, or the start of puberty, but it’s still worth raising at the next visit.
How Growth Timing Differs for Boys
Boys run about two years behind girls. Puberty starts anywhere between 9 and 14, averaging around 11, and the fastest growth comes roughly two years after it begins — so a boy can sit flat on his curve while the girls in his class are shooting up, then overtake them. On the chart that shows up as a line that looks stalled and then climbs steeply. It's the most common reason parents worry about a boy's chart and usually the least worrying explanation.
BMI on the Boys' Growth Chart
From age 2, the chart adds BMI-for-age, which the CDC uses to screen for underweight, overweight, and obesity.
- Below the 5th percentile: underweight
- 5th to below the 85th: healthy weight
- 85th to below the 95th: overweight
- 95th percentile and above: obesity
When a boy's BMI runs very high, providers turn to the CDC's Extended BMI-for-Age charts. These plot the curves above the 95th percentile that the original charts did not reach. A result at either end of the range is worth a closer look.
Before reading anything into it, the provider looks at how the boy has grown, his build, and his general health, because a lean, athletic boy and one carrying extra weight can land on the same BMI.
What a Low or High Height Percentile Means
Height percentiles draw a lot of parental worry, usually more than they need to. A boy at the 10th percentile for height who has tracked there consistently and has average-height parents is most likely right where his genes point him.
Providers look more carefully at the extremes, generally below the 3rd percentile or above the 97th, especially when a boy's height is far out of step with his family or when his curve changes direction.
Even then, it's the growth pattern over time, alongside his parents' heights and his overall health, that guides what comes next.
Pediatricians put a number on that family pattern with mid-parental height: add the mother's and father's heights together, add 13 cm (about 5 inches) for a boy, and divide by two. That number is a range, not a target: about 10 cm (4 inches) either side of it covers most boys (Barstow and Rerucha, American Family Physician, 2015). A boy tracking below the 3rd percentile whose parents are both tall is a very different picture from one tracking there whose parents are short, and mid-parental height is how a provider tells them apart.
When to Check With a Pediatrician
The signal to ask about growth is a change in the pattern, even when no single number looks alarming. Worth raising:
- Crossing percentile curves: a boy moving up or down across two or more major lines between visits.
- A curve that flattens: a boy whose growth levels off or stops when it ought to be rising.
- An extreme with other signs: a reading right at the high or low edge of the chart paired with other symptoms.
A boy who has sat at the 15th percentile his whole life, steady visit after visit, is very likely growing right on track.
Reading the Chart Over Time
Think of a growth chart as a running record, where each point only means something next to the ones before it. A doctor reading three or four visits together can spot a steady grower from one whose line has started to wander, long before any single number would.
A good practice keeps the right chart going at every visit and can pull a boy's whole growth history up on one screen. Develo, the AI-native pediatric operating system built solely for independent pediatric practices, plots growth automatically from documented vitals — the right chart for a child's age and sex, including the switch from WHO to CDC at age 2, corrected age for premature infants, mid-parental height, and BMI-for-age calculated without a separate tool — so the full history is on screen while you're still in the room.
The job left for parents is small. Show up for well child visits, follow up on developmental screenings, and flag anything that looks different.
Frequently Asked Questions
When Do Boys Stop Growing?
Most boys reach their adult height by their late teens. Height stops increasing when the growth plates at the ends of the long bones close, at the end of puberty. Because puberty starts anywhere between 9 and 14, with peak growth about two years after it begins, that finish line lands at different ages for different boys. Muscle and weight can keep developing into the early twenties.
Is a Low Percentile Bad for a Boy?
No, a low percentile isn't bad for a boy on its own. One who holds at the 10th percentile year after year is typically right on track, especially when his parents are on the shorter side.
Does a High BMI Percentile Mean a Boy Is Overweight?
No, a high BMI percentile is a screening result. It points to a possible concern that a provider then checks.
Do Boys Grow in Spurts?
Yes, boys grow in spurts. Growth tends to come in bursts between longer, steadier stretches, with the biggest surge arriving during puberty. This is why a boy can hold one percentile for a while, jump during a spurt, then settle again, all of it normal.
When Should Parents Worry About a Boy's Growth?
The main thing to watch is a change in the pattern. That could be a curve moving through two or more percentile lines in either direction, or one that levels off. A single high or low percentile rarely signals a problem by itself, because the direction of growth over time is the stronger signal.

%20(1).png)


.png)