

.avif)
A growth chart for girls turns a single height or weight measurement into a picture of how a child is growing over time compared to other girls her age. Once you know which lines to follow and what they mean, the chart becomes far less intimidating than it looks.
What a Growth Chart for Girls Shows
A growth chart maps a girl's measurements against those of girls her age, so her pediatrician can follow her growth over time. In the early years, they track length, weight, and head circumference, then height, weight, and BMI from age 2.
Because girls and boys grow differently, each sex has its own chart to keep percentiles accurate.
Which Growth Chart Is Used for Girls?
Two different charts cover childhood.
- Birth to 2 years: The CDC recommends the WHO growth standards for girls in this range. At this age, length is measured lying down, and the charts track length-for-age, weight-for-age, head circumference, and weight-for-length.
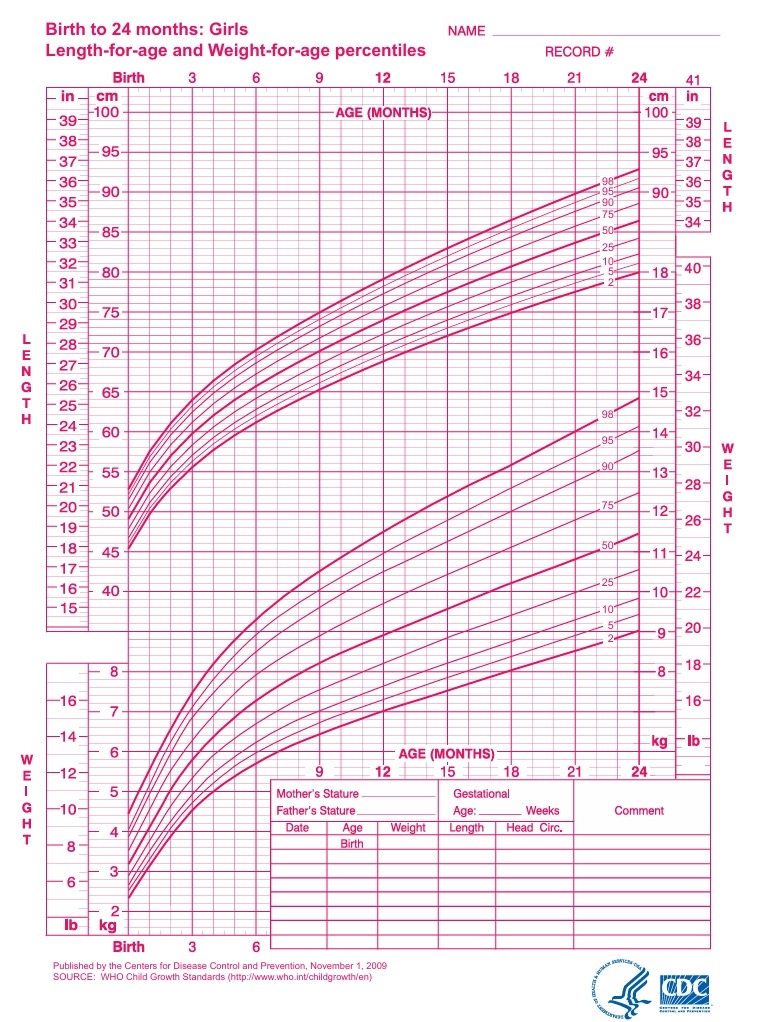
WHO-based CDC growth chart for girls, birth to 24 months (length and weight by age). Source: CDC / WHO
- 2 to 20 years: Girls move to the CDC growth charts, where height is measured standing. These track height-for-age, weight-for-age, and BMI-for-age.
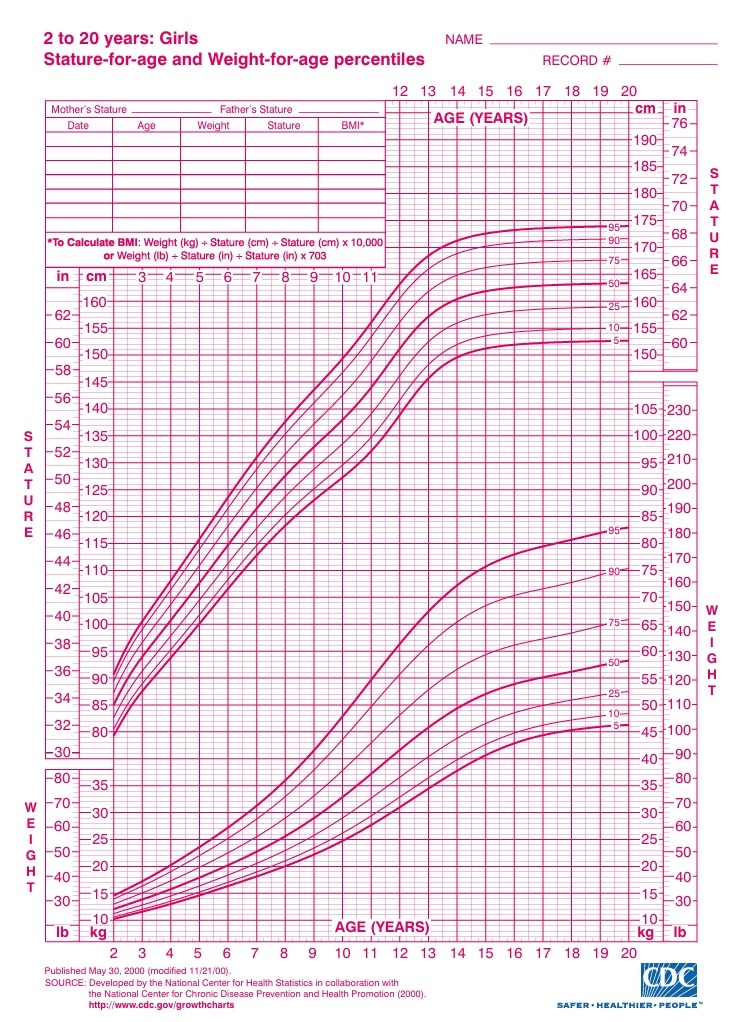
CDC growth chart for girls, ages 2 to 20 (stature and weight by age). Source: CDC
The switch changes the numbers for two reasons. The WHO charts are a growth standard — how healthy, breastfed children grow under optimal conditions — while the CDC charts are a growth reference describing how US children actually grew. And length measured lying down runs about 0.8 cm longer than height measured standing. So a girl can land on a different percentile at the 2-year visit without anything about her growth having changed.
How Growth Timing Differs for Girls
Girls and boys don't follow the same schedule. Girls usually start puberty earlier than boys — the AAP puts the typical range at 8 to 13 — and their fastest growth comes between the first breast development and about six months before their first period. That timing shows up on the chart.
A girl may cross into a higher percentile during that growth spurt, then settle as growth slows, which can be perfectly normal. Most girls grow another 1 to 2 inches after their first period, per the AAP, and gains beyond that are less common.
Because the pace varies so much from girl to girl, a single jump or slowdown near puberty calls for context before concern. The pattern over time still tells the real story.
What Percentiles Mean
A percentile shows where one girl falls among all girls of the same age and sex. A girl in the 60th percentile for height is taller than 60% of girls her age and shorter than 40% of them. The same logic applies to weight, head circumference, and BMI.
There’s no ideal percentile. A girl at the 15th percentile is not less healthy than one at the 85th. Healthy children fall all across the chart, so the number itself isn't a grade.
There is, though, a range that's specific to each girl. Pediatricians estimate it with mid-parental height: add the mother's and father's heights together, subtract 13 cm (about 5 inches), and divide by two. Most children finish within about 10 cm — roughly 4 inches — either side of that number (Barstow and Rerucha, American Family Physician, 2015). It's an estimate rather than a prediction, but it's why a girl tracking at the 10th percentile in a family of shorter parents reads very differently from the same percentile in a tall family.
How to Read a Girl's Growth Chart Step by Step
The chart looks like a grid of curved lines, but reading one point is straightforward:
- Find her age along the bottom of the chart and picture a vertical line up from it.
- Find the measurement (height, weight, or BMI) along the side axis and picture a horizontal line across.
- Mark the meeting point. That point is her measurement for her age.
- Read the curve closest to that point. Each curved line is a percentile, often the 5th, 10th, 25th, 50th, 75th, 90th, and 95th (some versions use the 3rd and 97th as the outer curves). The curve nearest your mark is her approximate percentile.
- Connect it to past visits. The line those dots form over time is what your pediatrician reads.
The Trend Is What Your Pediatrician Watches
A growth chart tells you the most about the path a child follows from visit to visit. Children tend to grow along a steady curve, so staying near the same percentile over time is a reassuring sign.
Your pediatrician pays attention when the pattern changes: a girl who climbs or drops across two or more major percentile lines, or whose curve flattens when it should be rising, is worth a closer look.
A change like that is a prompt to investigate, not a diagnosis — growth spurts, illness, and normal variation can all move the line.
BMI on the Girls' Growth Chart
From age 2, the chart adds BMI-for-age, the measure the CDC uses to screen for underweight as well as overweight and obesity. The percentile ranges break down like this:
- Below the 5th percentile: underweight
- 5th to below the 85th: healthy weight
- 85th to below the 95th: overweight
- 95th percentile and above: obesity
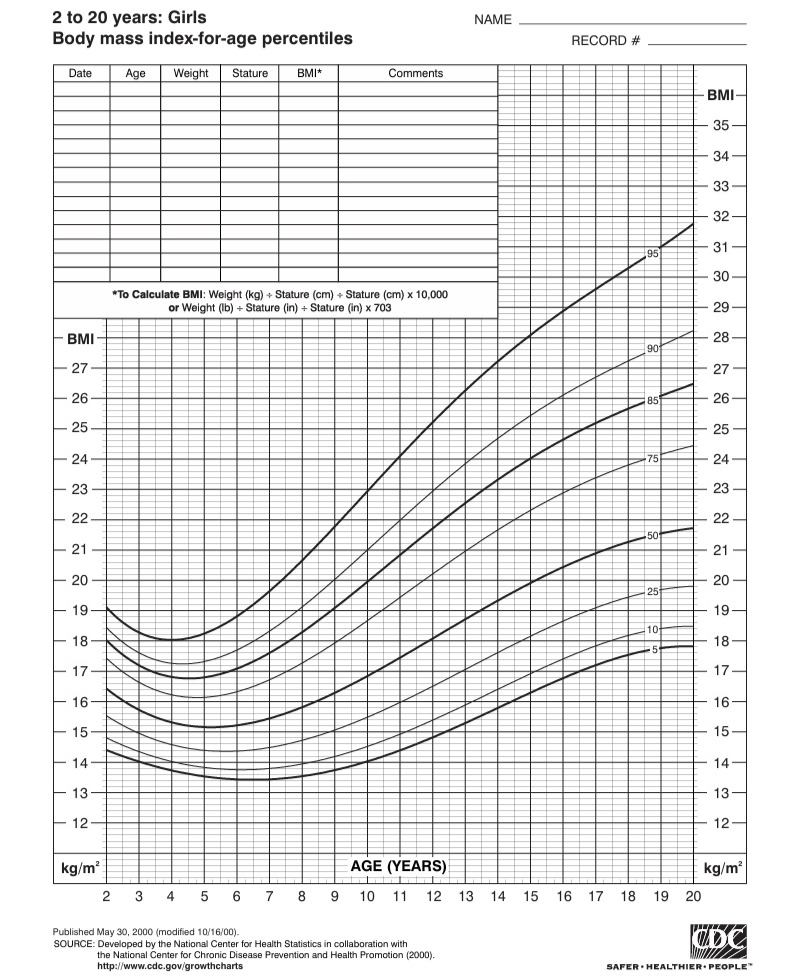
CDC BMI-for-age chart for girls, ages 2 to 20. Source: CDC
For girls with a very high BMI, pediatricians have used the CDC's Extended BMI-for-Age charts since their release in 2022, which add curves above the 95th percentile that the earlier CDC charts didn't plot.
A high or low reading is a starting point for a closer look. Your pediatrician weighs it against the child's growth history, build, and overall health before drawing any conclusion.
Where to Find the Official Girls' Charts
If you want to plot at home or check against the source, the CDC and WHO publish the girls' charts your pediatrician uses:
- Birth to 24 months (WHO-based): the CDC's WHO girls' charts for length, weight, head circumference, and weight-for-length.
- 2 to 20 years: the CDC's clinical growth charts for stature, weight, and BMI-for-age.
Your child's doctor plots these same charts at each visit, so what you plot at home should match what's in her medical record.
When to Talk to Your Pediatrician
Ask about growth whenever the pattern changes, even if no single number looks alarming.
- Crossing percentile lines: a girl moving up or down across several major lines between visits
- Flattening curve: growth that slows or stalls when it should be climbing
- Extreme with other concerns: a measurement near the very top or bottom alongside other symptoms
- Well off her family's pattern: a height that projects more than about 10 cm (4 inches) from her mid-parental height, defined as her mother's and father's heights added together, minus 13 cm, and divided by two
A girl who has tracked steadily at the 10th percentile her whole life is usually growing exactly as she should.
One Number Never Tells the Whole Story
A growth chart for girls tells you the most when you read it over time. One point on the curve says little by itself, while the line those points trace across visits shows whether your child is growing the way she should.
If a percentile climbs or drops, or a curve flattens, ask her pediatrician. The practices that do this well plot the right chart at every visit and pull up the full trend on the spot. Develo, the AI-native pediatric operating system built solely for independent pediatric practices, plots growth automatically from documented vitals — the right chart for a child's age and sex, corrected age for premature infants, mid-parental height, and BMI-for-age calculated without a separate tool — so the full trend is on screen while you're still in the room.
Your part stays simple. Follow the pattern, keep up with well child visits, and bring any changes to her doctor.
Frequently Asked Questions
What Is a Normal Percentile for a Girl on a Growth Chart?
There’s no single normal percentile. Healthy girls fall across the entire chart, so a girl at the 15th percentile and one at the 85th can both be perfectly healthy. Pediatricians look for steady growth along a consistent curve over time.
What Growth Chart Is Used for Girls Under 2?
Girls under 2 are tracked on the WHO growth standards, which the CDC recommends from birth to age 2 in US clinical settings. These charts measure length lying down and cover weight-for-age, length-for-age, head circumference, and weight-for-length. At age 2, girls move to the CDC growth charts.
Why Do Girls and Boys Have Different Growth Charts?
Girls and boys have different growth charts because their growth rates and timing differ throughout childhood. Plotting a girl against girls of the same age is what makes her percentile accurate, so getting the right chart for sex is as important as the right one for age.
Is the 50th Percentile the Best Percentile for a Girl?
No, the 50th percentile isn't a target. It marks the middle of the reference group, where half of girls are larger and half are smaller. A girl who tracks steadily at the 25th or 75th percentile is growing every bit as healthily as one at the 50th.
When Should I Worry About My Daughter's Growth Chart?
The trend tells you more than any single number. A curve that crosses two or more percentile lines, up or down, or one that flattens when it should be rising, is the main reason to check in with your pediatrician. One high or low percentile is rarely a concern by itself.

%20(1).png)

.png)